Predicting PlayStation Store Discounts with Machine Learning: 5,382 PS5 Games Analysed
Machine learning · Random Forest · scikit-learn · Feature engineering · Web scraping
Where the idea came from
It has probably happened to you. You buy a game for €70 on release day, and a few weeks later it's half price.
Consoles are going fully digital. It's official: Sony is ending physical disc production for new PlayStation games from January 2028. Players will end up locked into a single ecosystem, with one main store and pricing that can be hard to predict. No second-hand market, no shopping around: you pay whatever price it shows. And with subscriptions getting more expensive, a lot of players are going back to buying games one at a time.
So I wondered whether machine learning could see these price drops coming.
A simple question
A model needs a clear question, so I picked the simplest one possible, a yes-or-no question (a binary classification). For each game, the answer is yes if its price went down to -50% before its first anniversary.
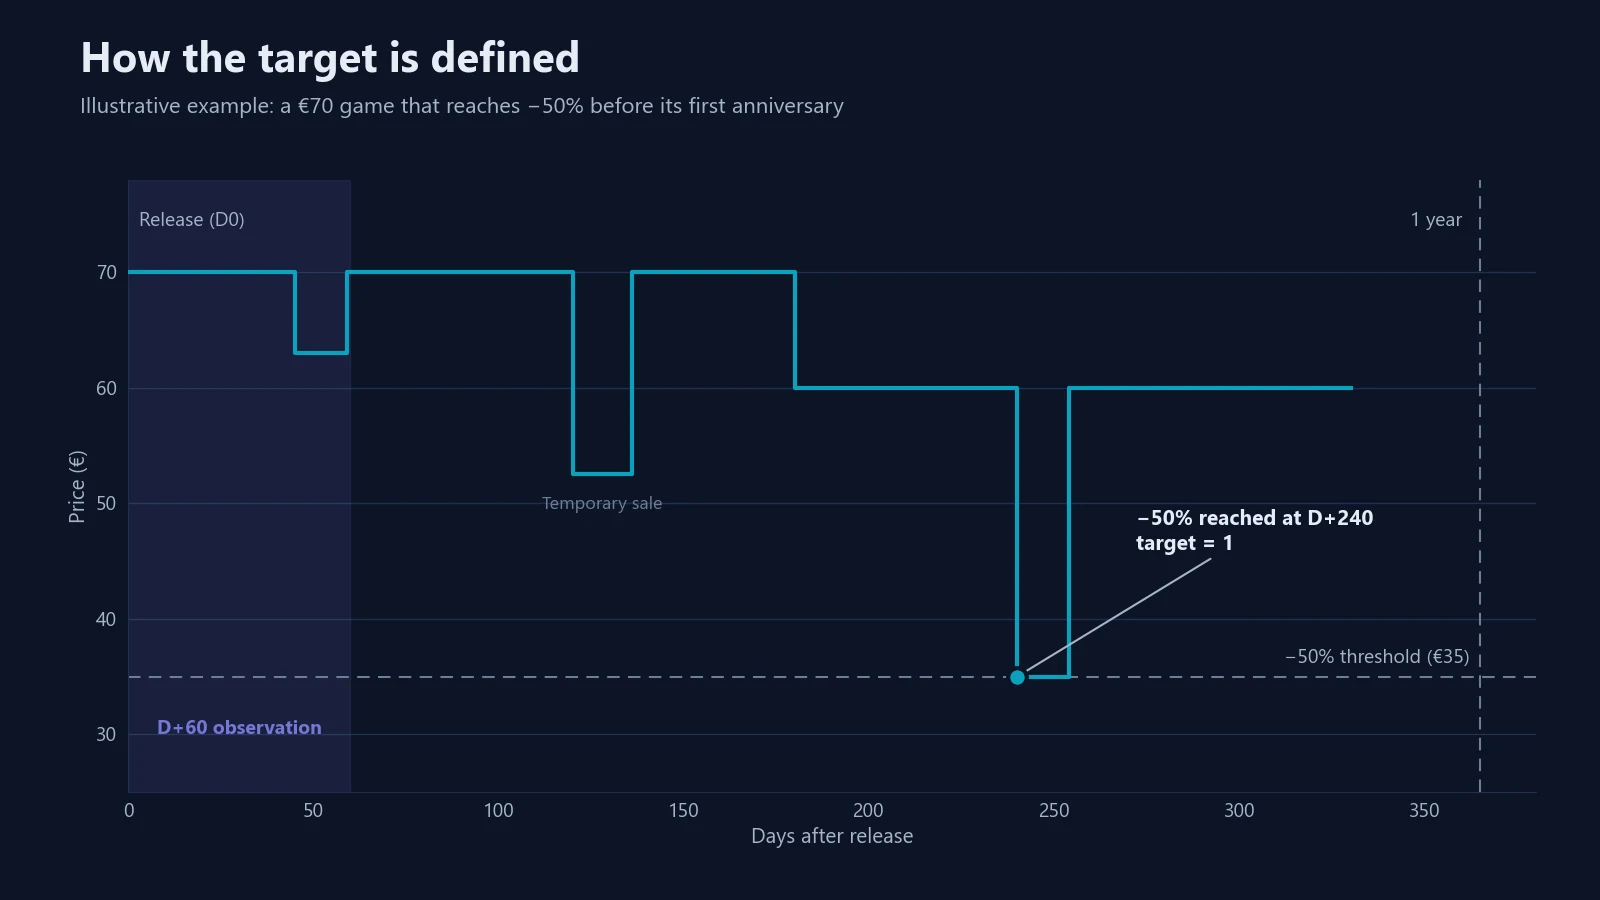
As the chart shows, prices move in steps. There are sales that last a few days, returns to the normal price, and sometimes a permanent cut. The exact price on any given day doesn't matter much. What we want to know is whether the -50% line was crossed within the year.
Building my own data
The first hurdle: the PlayStation Store has no public API. And the datasets I found on Kaggle had no price history. So I had to build everything myself.
First, you have to decide, intuitively, what data you want in the dataset: the features most likely to influence a price drop. For each one, I asked myself a question:
- Release date: does the game come out just before Black Friday?
- Base price: is it a AAA or an indie game?
- Publisher: do Ubisoft or EA have a predictable pricing policy?
- DLCs and microtransactions: with another source of revenue, can the publisher cut the base game's price faster?
- PlayStation exclusivity: with no sales on other consoles, does the price drop more slowly?
- And also genre, ratings and popularity.
This thinking phase is essential. It lets you focus on the data that's likely to bring value to the prediction, and it should be done with an expert in the field.
To get them, I combined three sources. PlatPrices gave me the PS4 and PS5 price history, and GG.deals added genres, tags and publishers. For the rest (ratings, multiplayer modes, compatibility), I collected the store pages through web scraping with Playwright, which I preferred to BeautifulSoup and Selenium after a few tests. The game's store ID is the common key that ties everything together.
Before collecting data from a website, ask for permission and say what it's for, education or commercial use. Also read the terms of use of the sites and APIs, and their robots.txt file: many of them limit or forbid scraping.
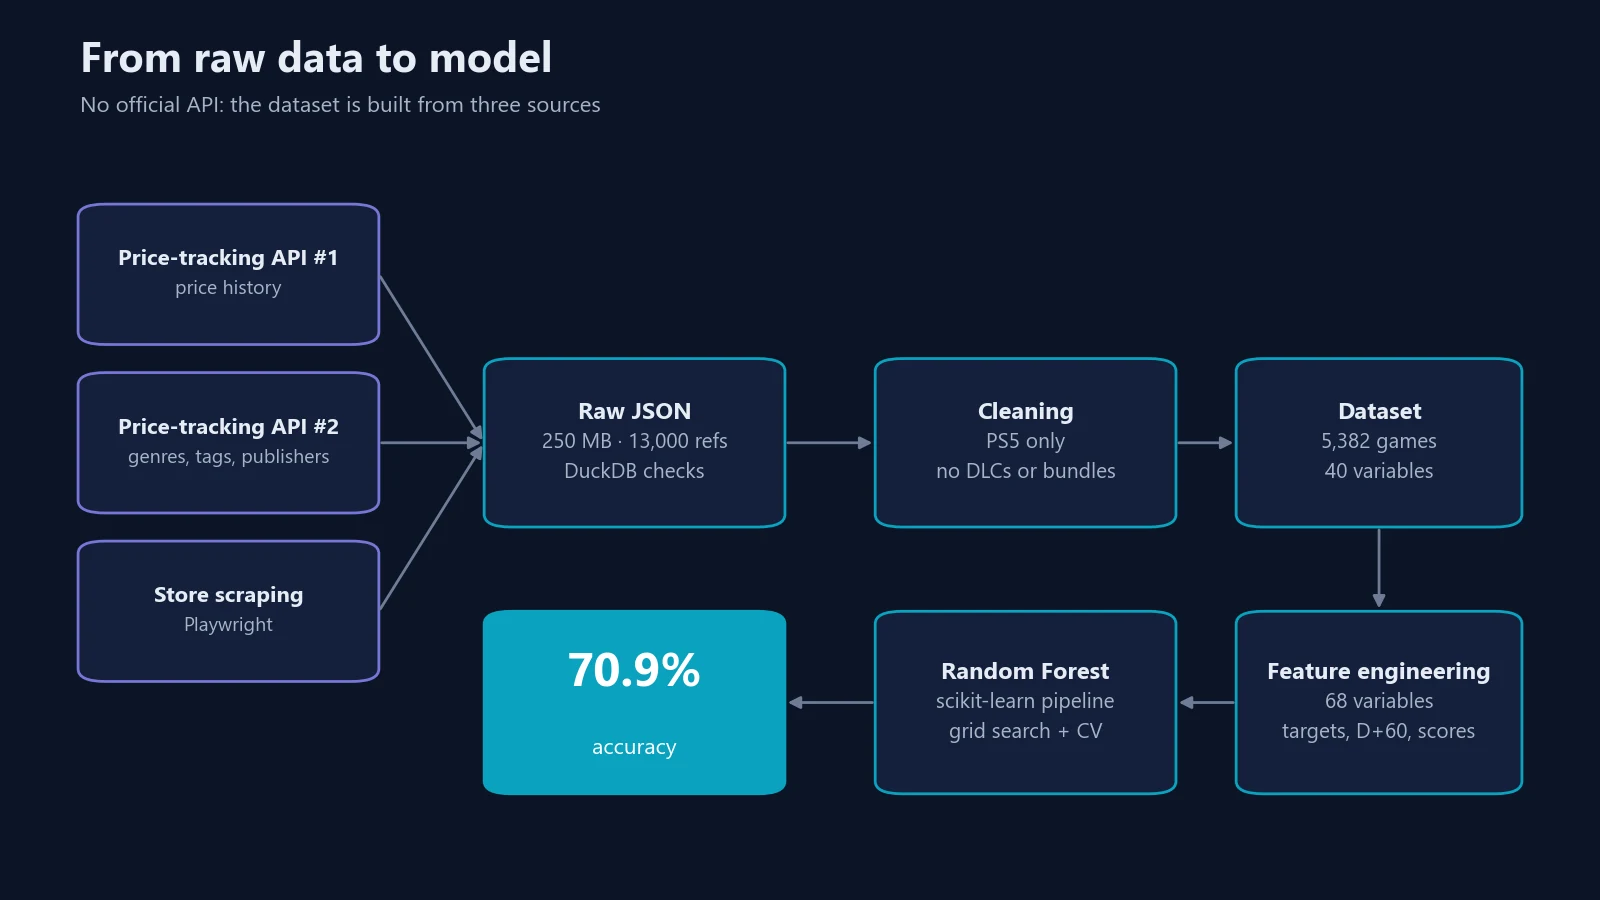
By the end of the collection I had a 250 MB JSON file with 13,000 references and around 160 fields per game (price, discount history, genres, publisher, ratings, size, languages, trophies…), many of them duplicated from one source to another. Before starting the clean-up, I ran a few DuckDB queries straight on that file to check there was enough usable data. For each variable, I looked at the share of missing values and checked for outliers. It tells you whether you need to go back and improve the collection before going any further.
Cleaning the data
The three sources didn't share the same format or the same names. So before analysing anything, the data had to be cleaned. It's the step no machine learning project can skip, and often the one that takes the most effort.
- The same game could show up several times. Each time, I kept the most complete row, the one with the fewest missing values.
- I merged the PlatPrices and GG.deals price histories, then removed invalid dates and impossible prices.
- "EA", "EA Sports" and "Electronic Arts Inc." are the same publisher. I grouped those variants, and tidied up languages and PEGI and ESRB ratings the same way.
- I filled in genres from the GG.deals tags.
Finally, I kept only PS5 games released since the console's European launch. I removed DLCs, bundles (which duplicate the base game) and games not yet released. That left 5,382 games and 40 variables (price, genre, publisher, ratings, features…), from November 2020 to October 2025.
With enough material in hand, it's time to move on to statistics. They're essential to understand how the data relates and to make the right choices for the prediction models to come.
What the numbers say
Exploratory data analysis is where you check that the data is consistent and makes sense. Here, it reassured me first: the data matches what we know about the market.
Before getting to the heart of the prediction, I used it to produce a lot of statistics about the PS5 games available on the PlayStation Store. They're all in the project's exploration notebook. A few examples:
- 9 games out of 10 drop in price at least once, and the median game gets 7 price drops.
- Half of all games lose at least 10% within three months of release.
- 42% of the games are indies.
- Half of all games are under 0.8 GB.
The analysis also showed me this wouldn't be easy. To build the correlation matrix, I had created the target variables: -50% within a year, plus other thresholds and other delays (for example -33% within 7 months). Taken on its own, no feature of a game is really tied to its price drops (every correlation stays below 0.3). So it takes a machine learning model that can combine several weak signals.
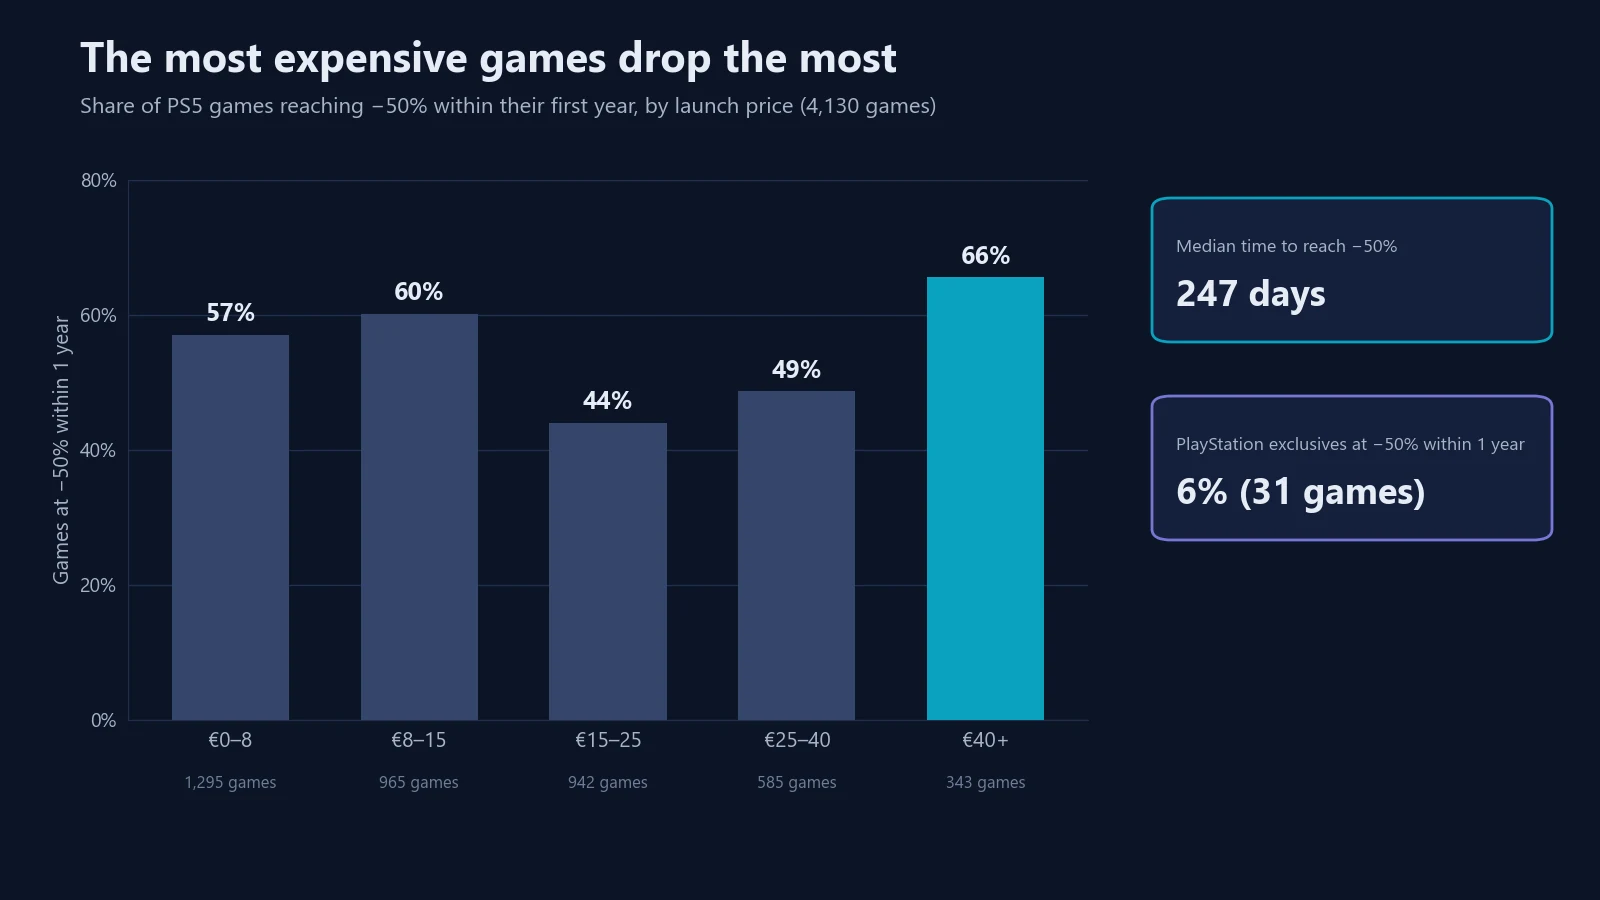
This chart surprised me. Games sold at €40 or more are the ones most likely to hit -50% within a year, two out of three. Across all prices, half of the games that reach -50% get there in under 247 days, about 8 months. PlayStation exclusives are the exception: only 6% drop that much in their first year. The sample is small (31 games), but the gap is clear.
To strengthen the correlations with our target variable (the -50% drop), let's try to create new, stronger features through feature engineering.
Preparing the variables
This feature engineering step took the dataset from 40 to 68 variables.
I started by adding an observation at day 60, which says whether the game had already lost 10% two months after release. It's a strong indicator: a quick price drop is often a sign of disappointing sales, and points to bigger drops later on.
The other variables group information in a more meaningful way. There's a content score (play time, trophies, DLCs, multiplayer, languages, game size), a visibility score (press and player ratings, media presence), publisher tiers, broad genre families, price bands, the release season and a unified PEGI rating.
I also watched out for data leakage. A game's age or its current popularity, for example, aren't known on release day. Leaving them in would have produced nice scores that wouldn't hold up for a game that has just come out.
Choosing and training the model
Heads-up: from here on, things get more technical and assume some machine learning basics. If you want to learn, Alyra runs training courses on the subject (in French).
When you want to predict prices, time series usually come to mind. Here they weren't the right tool:
| Approach | What it brings here |
|---|---|
| ARIMA | Forecasts a game's price from its own past prices, but doesn't compare games with each other |
| Deep learning (LSTM) | Needs long series per game, while the price histories are short and irregular |
| Supervised learning (Random Forest, Gradient Boosting…) | Learns the link between a game's features and its price drops |
I started with a Random Forest, which copes well with mixed data like mine, full of categories. The data goes through a scikit-learn pipeline that fills in missing values and encodes each type of variable. I tuned the hyperparameters with a grid search and cross-validation.
To judge the results I used accuracy, the share of correct answers. It works here because both answers are about as common as each other (45/55), and both mistakes cost the player roughly the same: waiting for a sale that never comes, or missing one.
The first try, using only what's known on release day, got 66.2% right on the test data but 83.1% on the training data. A gap like that is the classic sign of overfitting: the model was memorising instead of generalising. So I limited the depth of the trees and added the day-60 observation. The score went up to 68.5% and the gap shrank.
To limit overfitting further, I built several sets of variables and trained the model on each one, so I could keep only the most useful. The fewer useless variables there are, the less noise the model can learn by heart. There are also methods to automate this sorting, such as the feature importance computed by the Random Forest, or scikit-learn's recursive feature elimination (RFE).
The variables from the feature engineering step then brought the score to 70.2%, then handling outliers (with the interquartile range) and one-hot encoding took it to 70.9%. I also tried scaling the numeric variables, which changed nothing, as you'd expect with a Random Forest.
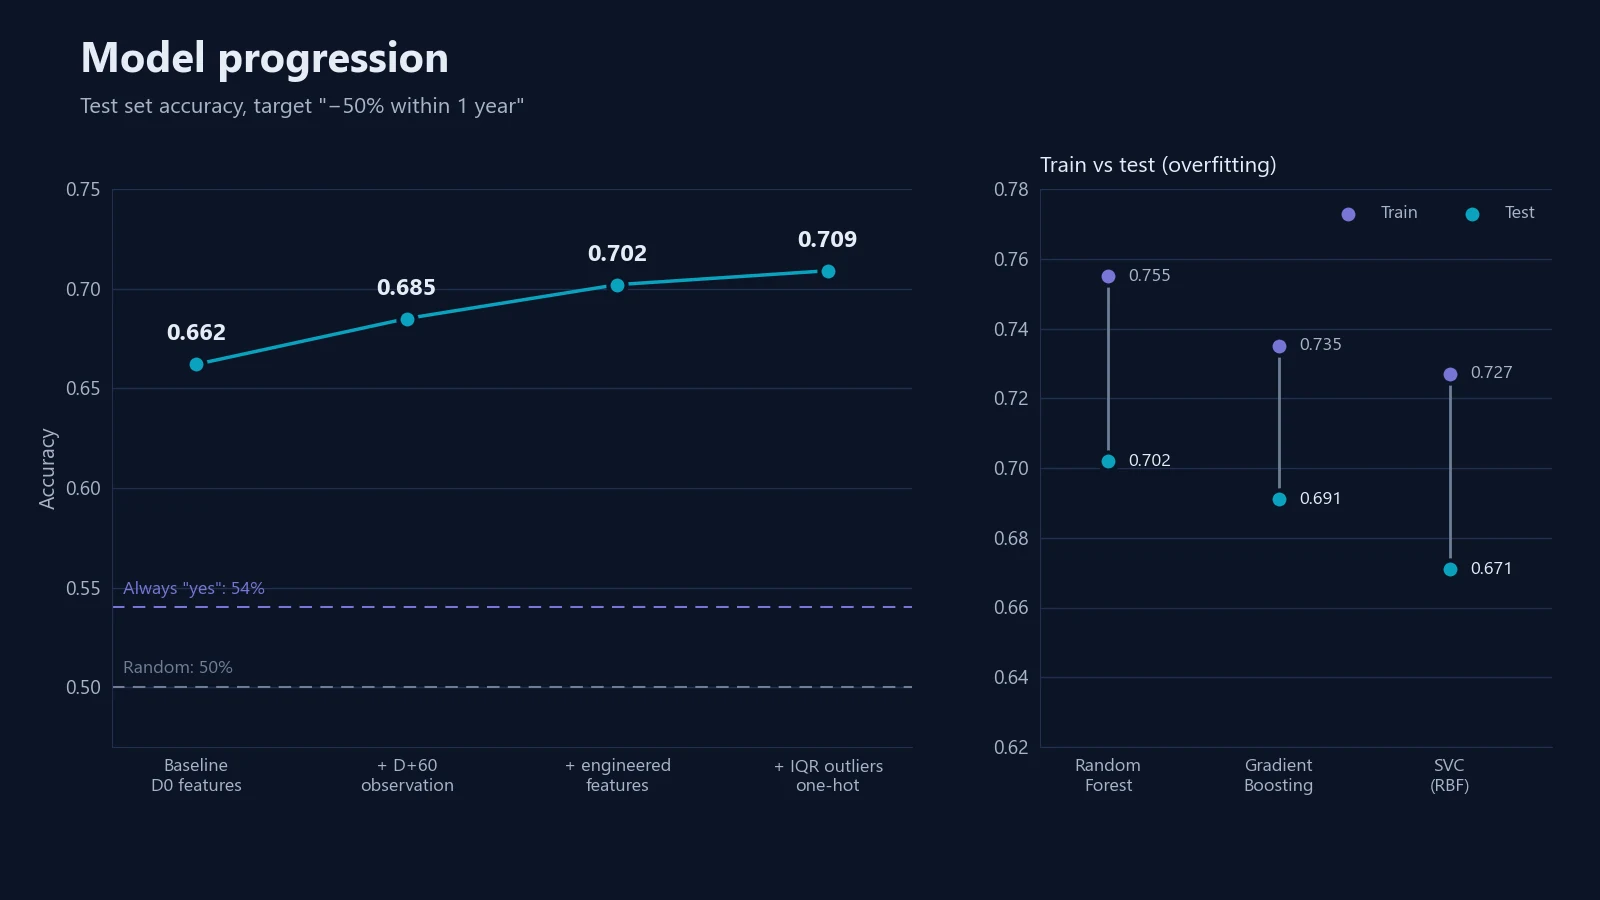
Then I compared it with Gradient Boosting and a support vector machine (SVC) on the same variables. Both memorise less, but score a little lower. My takeaway is that the limit comes mostly from the data, not the algorithm.
Is 70% any good?
It depends on what you'd get without a model. A program that always answered "yes, there will be a sale" would already be right 54% of the time, since that's the share of games that do drop. So my model does about 16 points better. It's not spectacular, but when you're deciding whether to wait before buying a game, it's already real help.
What about other questions?
I used the dataset to try a few other variants:
| Question | Type | Result (test) |
|---|---|---|
| -75% within 3 years? | Yes / no | 77.9% correct |
| -33% within 7 months? | Yes / no | 72.5% correct |
| How soon -33% or -50%? (5 ranges) | Multi-class | 42 to 46% correct |
| How many days before -50%? | Regression | 137 days off on average (mean absolute error), R² of 0.21 |
Both yes/no questions work well and matter directly to players. As soon as you ask for more precision, things fall apart. With five time ranges the model is wrong more than half the time, and the regression misses the right date by more than four months on average. For this kind of problem, a simple, reliable answer is more useful than a precise prediction that's often wrong. It's also easier to explain to the people who asked for the study and to the business teams, and explainability matters a lot in AI. When a fine-grained prediction doesn't work, changing approach or simplifying it can still bring a lot of value.
What a player would actually see
Here's what a game page could look like in an app:
A PS5 game sold at €70 50% drop likely within a year (85% confidence) Advice: wait 6 to 12 months Expected price around €35, so €35 saved
If you want to try this yourself
A few tips from this project:
- Don't count too much on ready-made datasets. For a specific question you often have to build your own, and that's where I learned the most.
- Start with a yes/no question, and work out the score of a naive model that always gives the same answer before you get excited about a result.
- For every variable, ask yourself whether you'd know it at prediction time. If not, take it out.
- Waiting a little can help a lot. Here, two months of observation clearly improved the predictions. Talk it through with the business side and try to negotiate a wider frame, for example a prediction made two months after release rather than on day one.
- Test your assumptions, even the ones that seem obvious.
What's next
There are several ways to improve the model. The most promising would be adding the date a game joins a subscription catalogue, along with competing releases at the time. I could also add PS4 games and DLCs to the dataset, or try AutoML tools like H2O and auto-sklearn, and automatic feature selection. And why not build an online app to help players, covering every video game store (PlayStation, Xbox, Nintendo, Steam…).
The whole project is on GitHub: the collection, exploration, feature engineering and modelling notebooks, plus the final dataset.
Thanks to the Alyra team for the resources and advice provided during this project, and to the PlatPrices admin for access to their API.
PlayStation and PS5 are registered trademarks of Sony Interactive Entertainment Inc. This is a personal project, not affiliated with or endorsed by Sony.
The code and results published on GitHub are provided for educational purposes. They may contain errors and shouldn't be used as they are. For any use other than personal or educational, please get in touch first.